LeanBuild – Cloud based project management software
How it started
LeanBuild came to us with a clear vision: construction teams deserve better tools. The industry runs on spreadsheets, printed schedules, and phone calls. That approach falls apart the moment a project grows beyond a handful of tasks. The founder had worked in construction long enough to know that poor visibility into schedules, resources, and quality was costing teams time, money, and morale.
The idea was a cloud-based platform that would bring structure to the chaos of construction project delivery. Not a generic project management tool, something purpose built for how construction actually works, with phases, substructures, procurement, and quality checklists baked into the product from the start.
We began with a Design & Discovery phase to map out the workflows that mattered most. Scheduling, resource allocation, procurement, and quality control. Then moved into building the MVP. The goal was to deliver a working product that a real construction team could use on a real project, covering the full lifecycle from initiation through to closing.
The challenge
Construction project management sits in an unusual space: the workflows are complex, the stakeholders are varied, and the tolerance for clunky software is low. Site managers and contractors aren’t going to spend twenty minutes learning a tool, it needs to make sense immediately.
What We Built
Over nineteen months, LeanBuild grew from concept into a comprehensive construction project management platform covering the full delivery lifecycle.
Project Lifecycle Management
The platform structures every project into four distinct phases: Initiation, Planning, Execution, and Closing. Each containing its own set of processes and tasks. This gives project managers a clear roadmap from day one, with every step mapped out and nothing falling through the cracks. Below are some of the important parts within these phases.
Project Dashboard
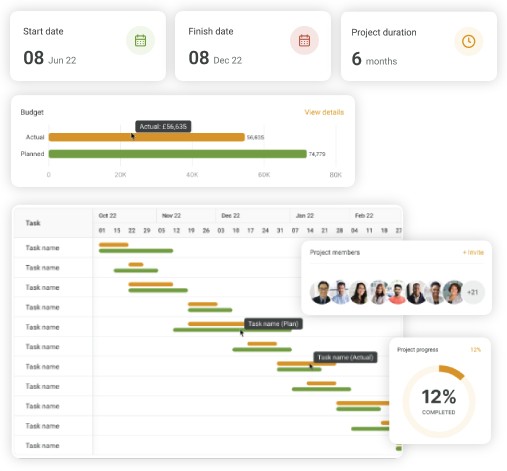
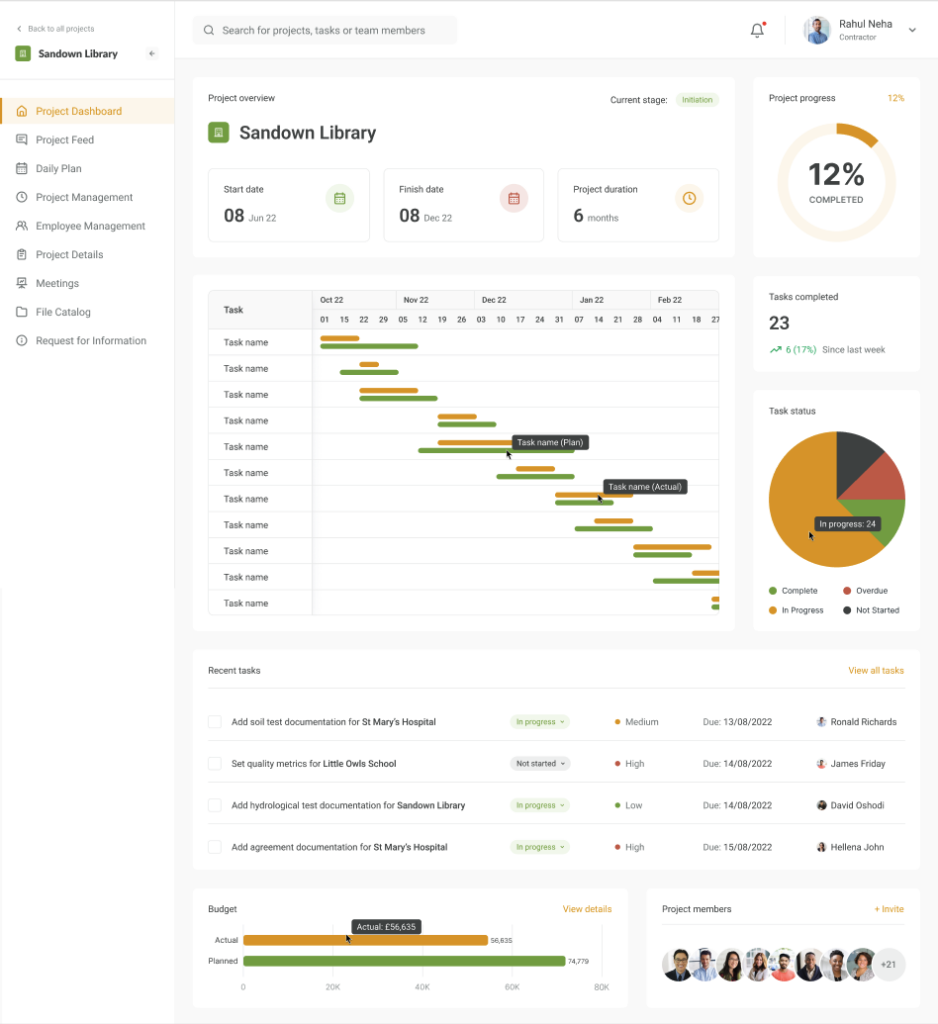
Each project opens to a rich dashboard that gives an overview of everything that matters: start date, finish date, planned duration, and a circular progress indicator showing overall completion percentage. A miniature Gantt chart shows the timeline of all tasks with planned versus actual bars.
Alongside it, widgets display the number of tasks completed (with week-on-week trend data), a pie chart breaking down task statuses (complete, in progress, overdue, not started), a list of recent tasks with priority levels, status badges, due dates and assignees, a budget comparison bar showing actual spend against planned budget, and a view of all project members. The dashboard is the command centre. One screen that tells a project manager whether things are on track or need attention.
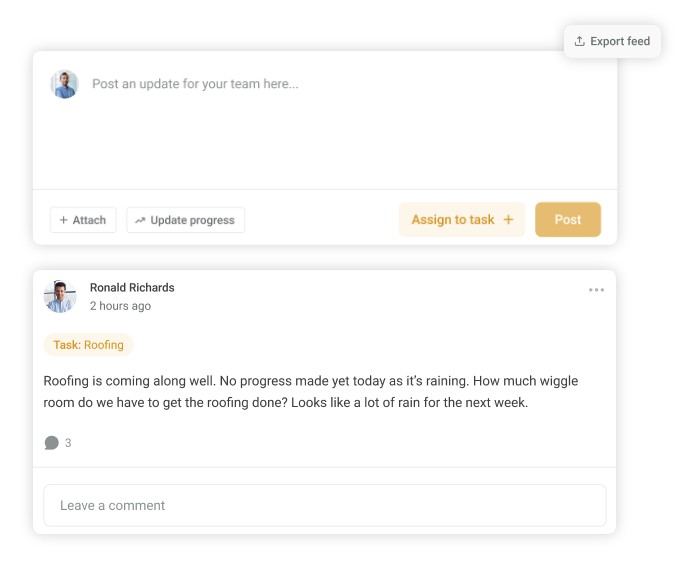
Project Feed
The project feed acts as a social-style communication hub for each project. Team members can post updates, attach files, link updates to specific tasks, and report progress. All in a chronological feed visible to the entire project team. Posts support comments and can be filtered by task, making it easy to find the conversation around a specific piece of work. A sidebar shows key project metadata (creation date, status, current stage, start/finish dates, duration) and team members. The feed can also be exported, giving teams an auditable record of project communication.
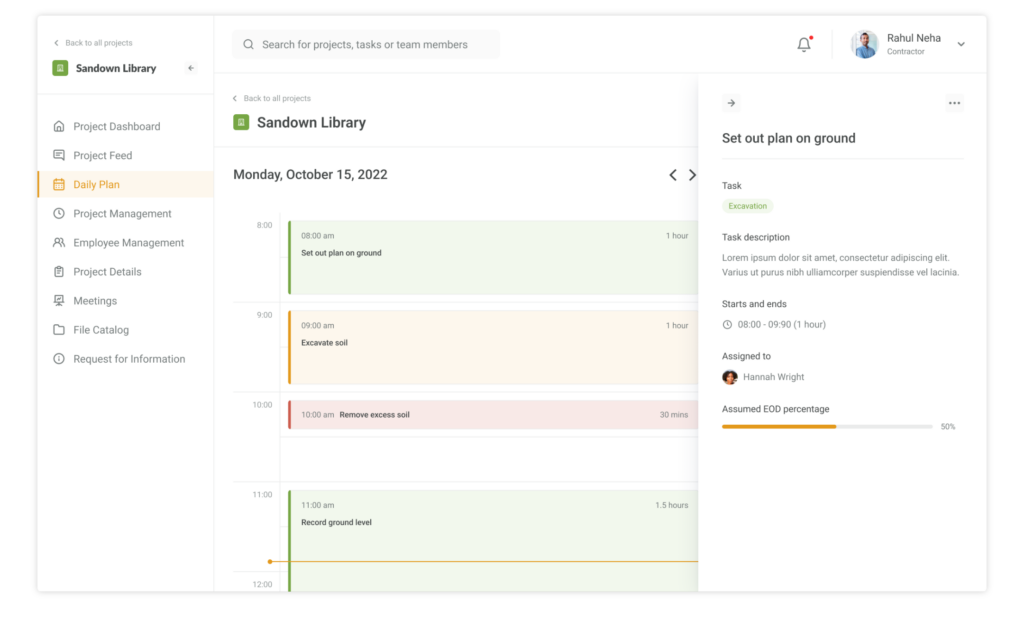
Daily Plan
The daily plan gives individual team members a time blocked view of their day. Tasks are laid out on a calendar-style timeline showing start time, duration, and task name. Selecting a task opens a detail panel showing the parent task category, full description, start and end times, the assigned team member, and an assumed end-of-day completion percentage. This view bridges the gap between high-level project scheduling and what someone actually needs to do today. Turning the project plan into actionable daily work.
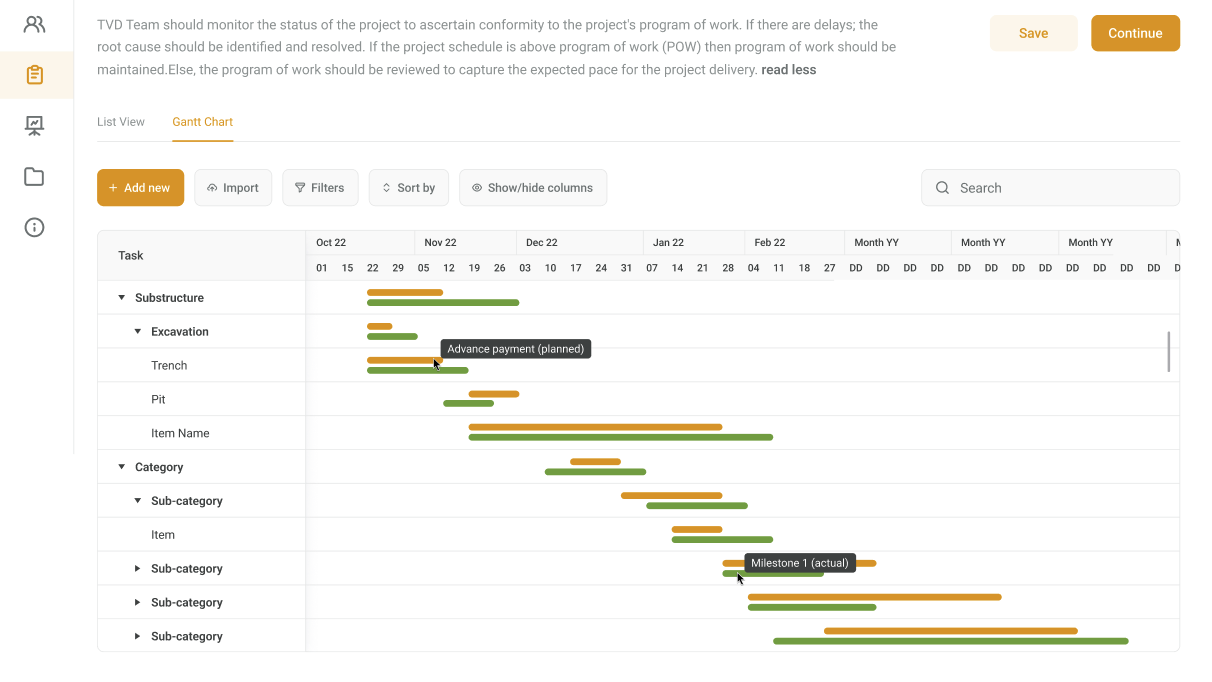
Plan Schedule – List View & Gantt Chart
The scheduling engine is the core of the platform. In list view, project managers create and manage tasks with IDs, phase names, durations, start and finish dates, and precedence relationships. The Gantt chart view transforms this data into a visual timeline. With colour-coded bars distinguishing planned versus actual progress, milestone markers for key deliverables, and payment schedule indicators overlaid directly onto the timeline. Tasks are grouped hierarchically by phase and sub-category, and the chart supports expanding and collapsing sections for easy navigation of complex schedules.
Cost Management & Data Import
The cost management module tracks budgeted versus actual costs at every level of the project hierarchy. From individual activities up through subcategories to top-level phases. Each line item captures budgeted and actual quantities, rates, amounts, budget allocation, payments, and balance. The dashboard view provides a visual bar chart comparing actual spend against planned budget across the whole project.
Critically, the platform supports importing cost data directly from Excel spreadsheets via a guided four step workflow: upload the file, match columns from the spreadsheet to the platform’s data model, preview and categorise the imported data (assigning parent categories and subcategories), and finalise the import. This means construction firms can bring their existing bills of quantities and cost breakdowns into the platform without re-entering data manually.
How We Worked
The project ran as a focused engagement with a small, senior team. We started with Design & Discovery to map out the construction-specific workflows and data structures, then moved into iterative MVP development. Building, testing, and refining each module in close collaboration with the LeanBuild team.
Communication was direct and frequent. The LeanBuild founder brought deep domain expertise in construction project management, which was critical for getting the detail right. Things like how precedence relationships work in construction scheduling, what a realistic quality assurance workflow looks like on site, and which resource categories actually matter to a project manager. Our job was to translate that knowledge into a product that felt intuitive to use.
Technology
The platform is built as a modern single-page application using React with TypeScript, bundled with Vite for fast builds. Material-UI provides the design system, Zustand manages application state, and TanStack React Query handles data fetching with intelligent caching. API clients are auto-generated from the backend’s OpenAPI specification, ensuring type safety across the stack.